Murine Aging Cell Atlas
- 5 minsMammals are a constellation of distinct cell types, each with a specialized function and lifestyle. Recent cell atlas efforts suggest there are more than 100 unique cell types in a single mouse.
Do these different cell types experience aging in different ways? The diversity of cellular physiology in mammals – from short-lived spherical neutrophils to long-lived arboreal neurons – suggests that aging may manifest differently across cell identities. However, it’s difficult to compare and contrast aging phenotypes measured in individual cell types using different technologies in different laboratories in an apples-to-apples manner.
Along with brilliant collaborators, I recently explored this question at Calico using single cell genomics to obtain comparable measurements of aging phenotypes across cell types. Check out our paper in Genome Research, see our research website where you can interact with the data, or read a brief description of some key highlights below.
Cartographing aging across three murine tissues
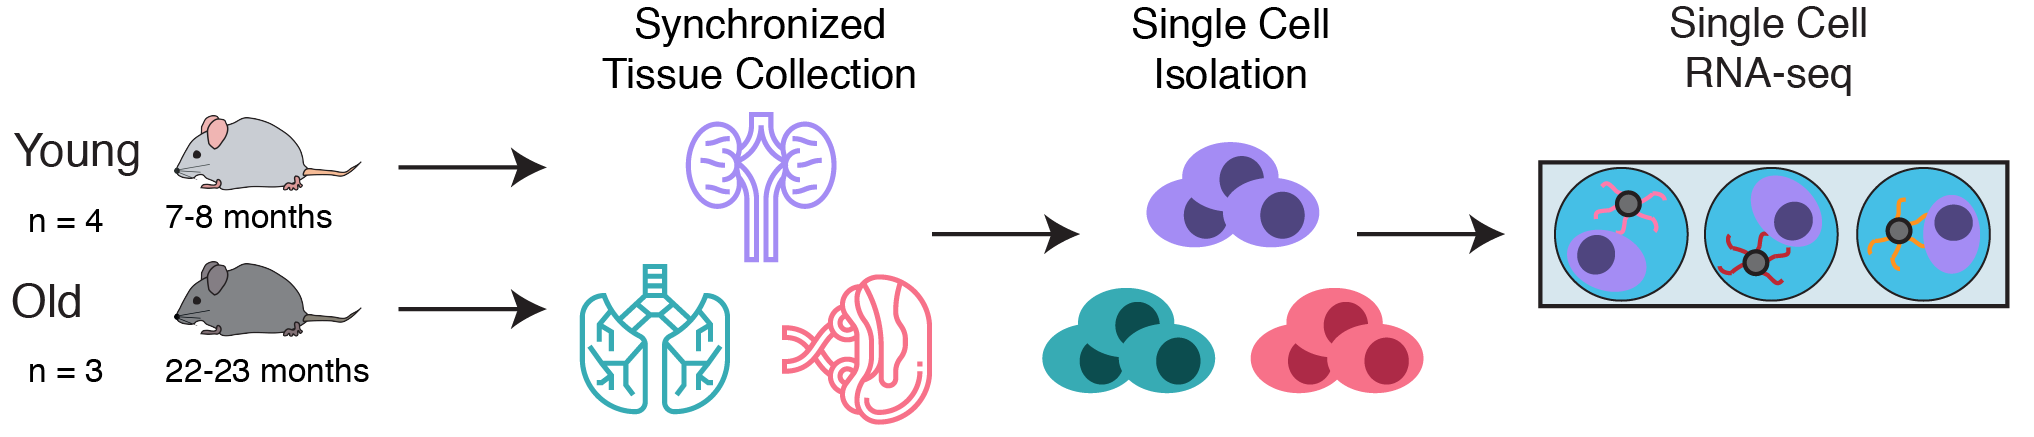
To explore this question, a collaborative team at Calico leveraged single cell RNA-seq to simultaneously measure the gene expression state of many different cell types in the kidneys, lungs, and spleens of young and old C57Bl/6 mice. These simultaneous measurements allowed us to compare aging phenotypes across many cell types.
Identifying common aging phenotypes across cell types
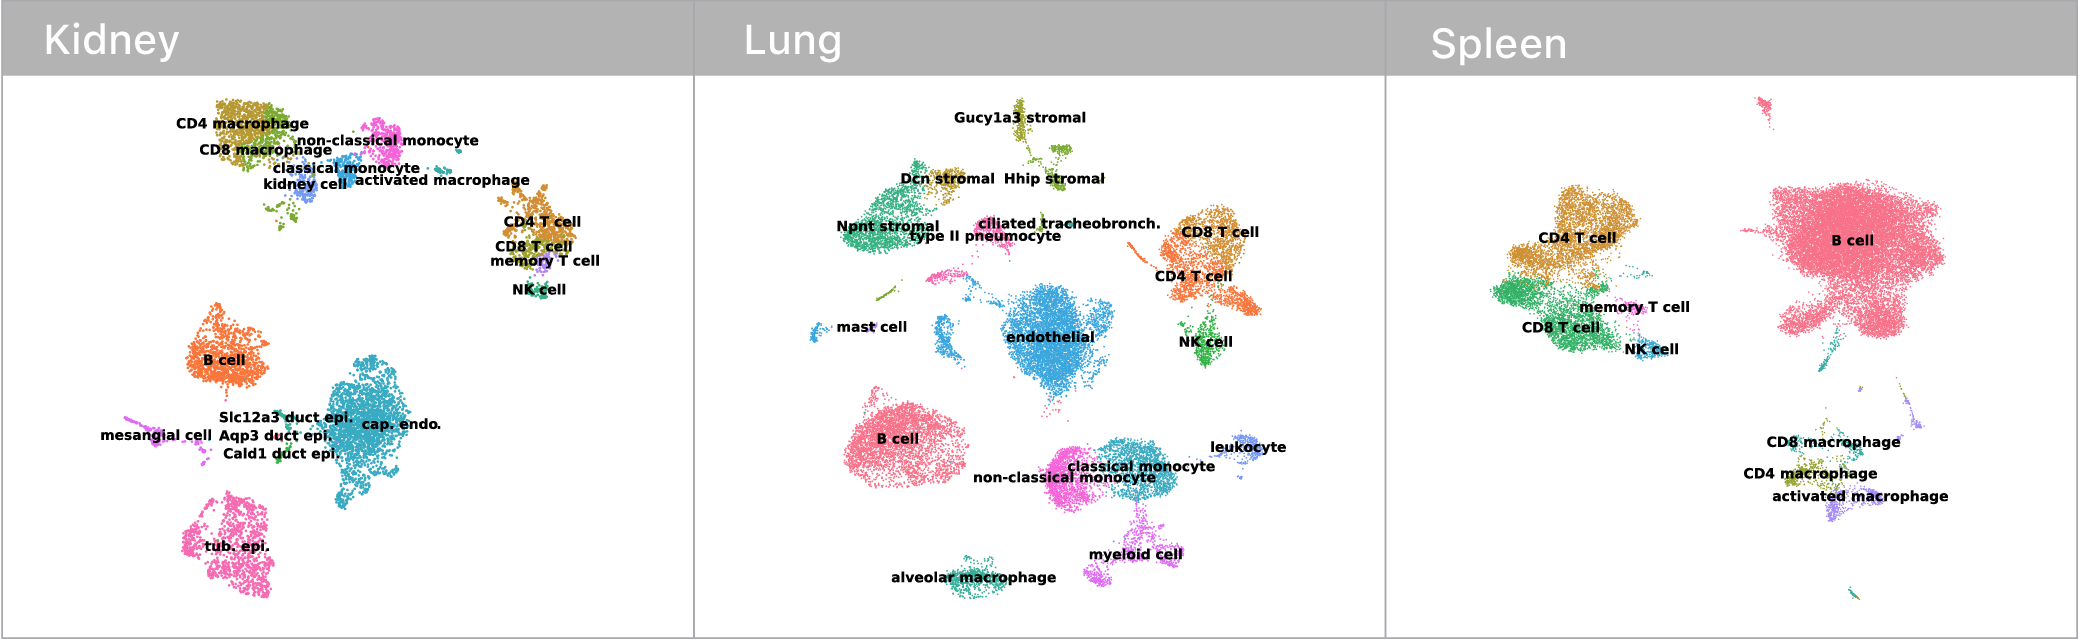
Before we could make any of these comarisons though, we first had to identify which mRNA abundance profiles corresponded to which cell types. This is surprisingly tricky! Some cell types have nice binary marker genes (i.e. CD3 defines the T cell compartment, if you have it, you are a T cell). However, many others do not.
Traditionally, expert biologists will cluster single cell mRNA profiles and manually inspect the expression signatures to assign cell types. Given that I’m not an expert in kidneys, lungs, or spleens, this didn’t seem like the most tractable approach at the outset. Luckily, the Tabula Muris consortium recently released an expert annotated data set containing single cell mRNA profiles for every tissue in the mouse. We trained a deep neural network on this corpus and used it to classify cell types in our own data. Given these neural network guesses as starting points, the remaining manual confirmations of cell type identity where much easier.
Most transcriptional changes are cell type-specific, only a few are common
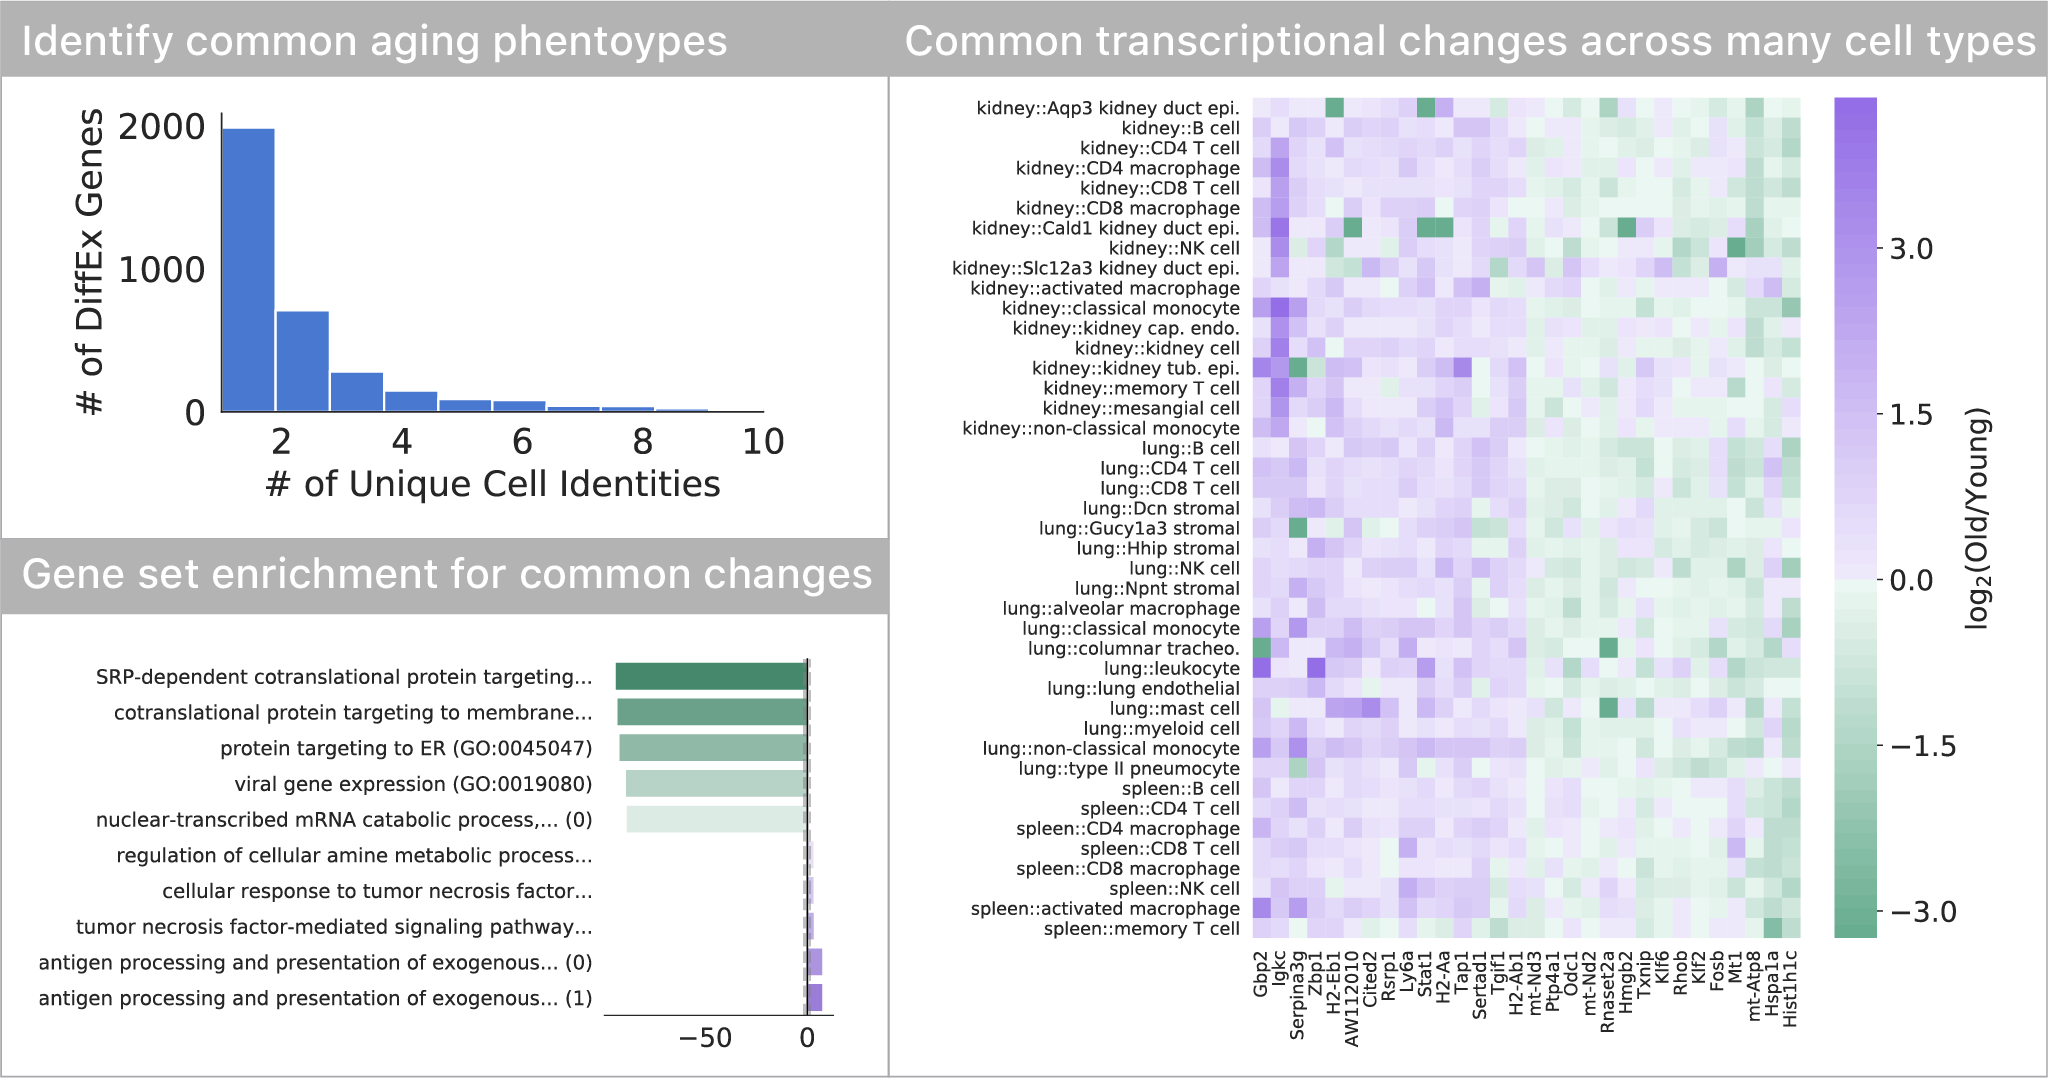
Comparing differential expression with age, we found that most of the transcriptional changes are specific to one or just a few cell types. Only a small subset of changes appears to occur in many (>5) cell types in the tissues we profiled. This set of genes indicates a decrease in endoplasmic reticulum protein targeting with age, also seen in S. cerevisiae. As seen in many other studies, we also find a common upregulation of inflammatory pathways.
Comparing aging trajectories
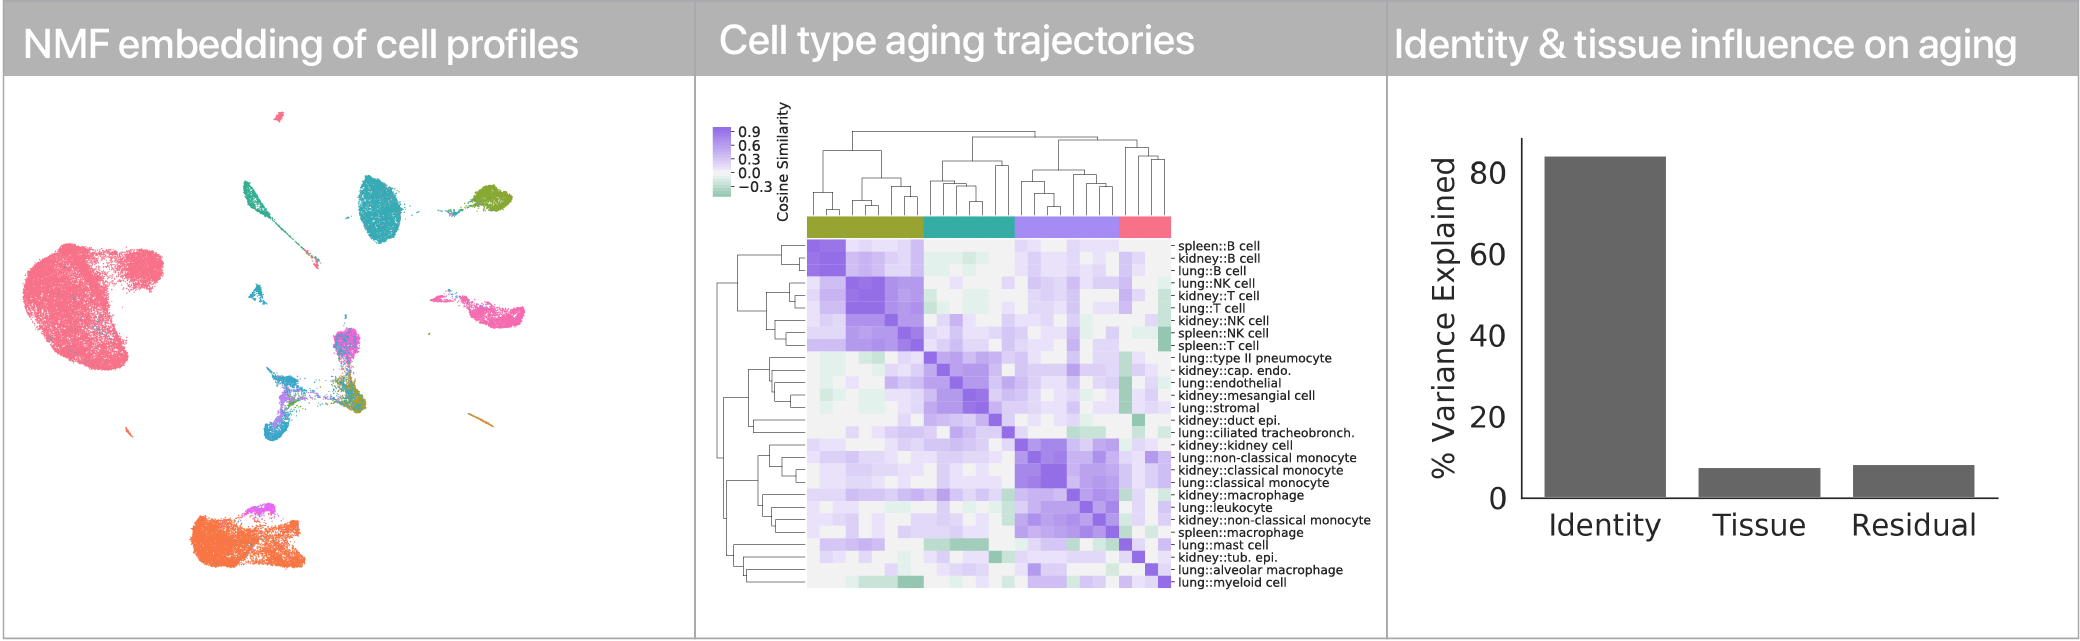
The differential expression results above suggest that cell types age in different ways. Can we quantify these “aging trajectories” and compare them across cell types? We leveraged a non-negative matrix factorization to summarize mRNA profiles at the level of gene expression program activity, and within this space we compute vectors that describe the difference between young and old cells in each cell type. Comparing these vectors, we find that while similar cell types have similar aging trajectories (i.e. lymphocytes), dissimilar cell types have dissimilar trajectories (i.e. myeloid cells vs. endothelial cells).
Measuring aging magnitudes
Do some cell types age more dramatically than others? How might we even measure that? Comparing differences between discrete populations in high-dimensional spaces (like gene expression space) is dicey business. Some of the simplistic metrics you might think up actually miss important differences that might arise between populations. As just one example, the intuitive comparison of differences between the population averages actually misses differences that can arise in covariance structure of population modality.
To account for all these types of variation that may arise with age, we instead leveraged discrete optimal transport distances. Optimal transport distances (a.k.a. the earth-mover distance, the Wasserstein distance) measure the minimum amount of movement needed to make two evenly sized samples match one another. As an intuition, if we have a big, irregular pile of dirt and want to build an equally sized rectangular pile of dirt, an optimal transport distance between the two shapes would describe the minimum amount of dirt we need to move to the irregular pile rectangular.
To use this distance with discrete samples of unequal size, we perform bootstrapping with random samples of equal size from young and old populations of cells. As a null distribution, we compute distances between random samples of only young or only old cells, and normalize the Old-Young distance by the larger of these nulls. Here’s what the optimal transport for a comparison of young and old spleen B cells looks like.
When we compute these distances across all cell types we observe, we see multi-fold differences between cell types.
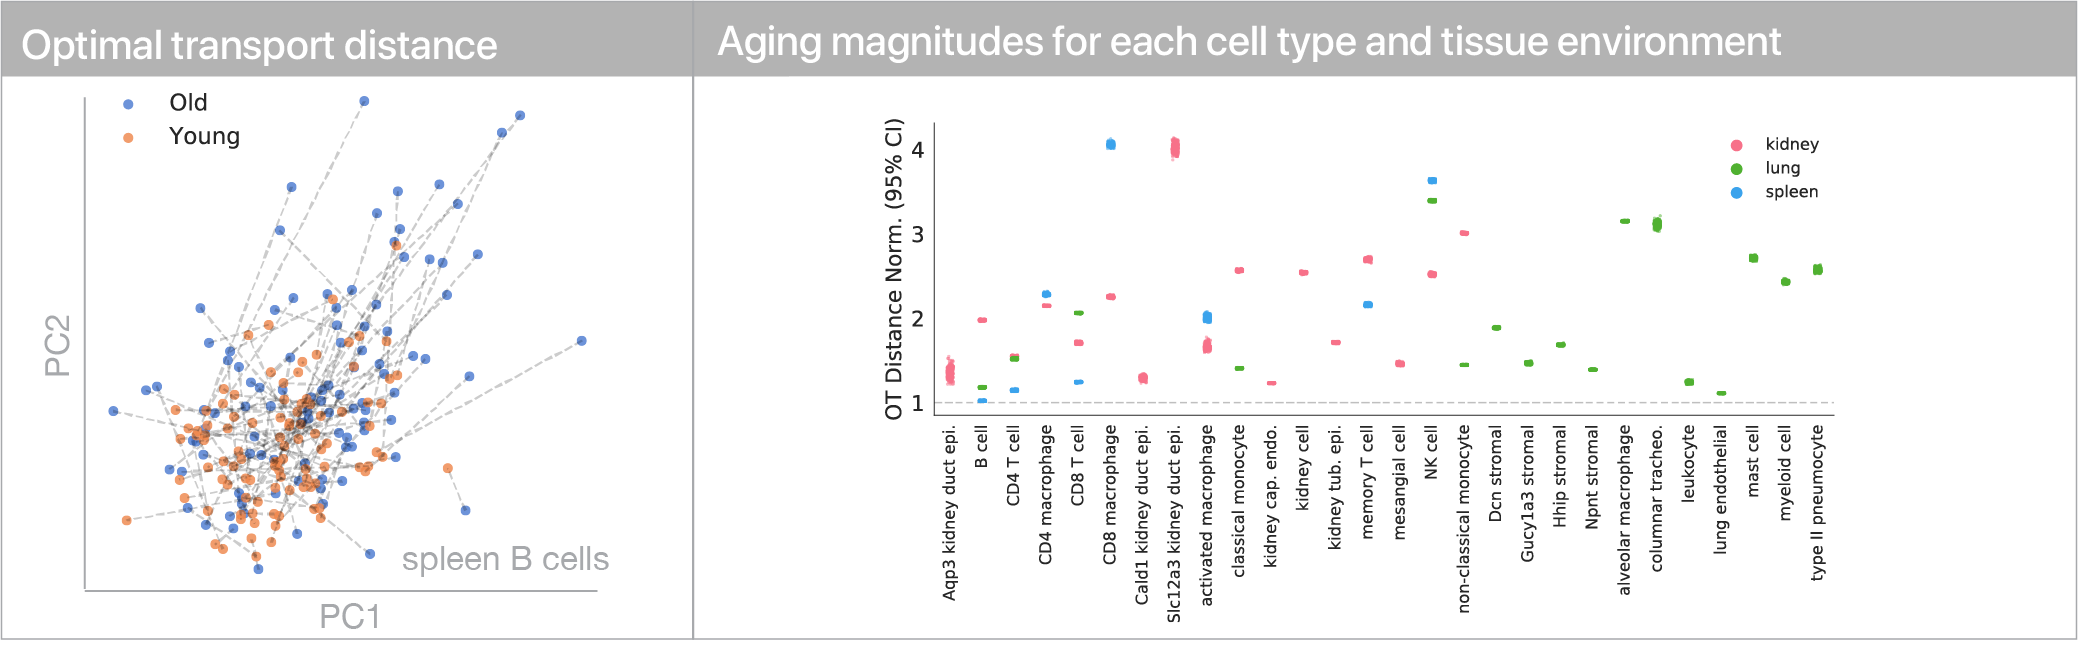
Using linear modeling, we find that cell type explains most of the variation in both aging trajectories and magnitudes, while tissue environment is a minority influence. This suggests that for cells, who you are influences how you age more than where you live.
Dive in!
We’ve opened up the data to the scientific community at our Calico Research website. I’d love to hear any thoughts on these results, or any results you dig out on your own by email.

Jacob C. Kimmel
Co-founder & Head of Research @ NewLimit. Interested in aging, genomics, imaging, & machine learning.